Finding Dynamic Strings in ELF Binaries

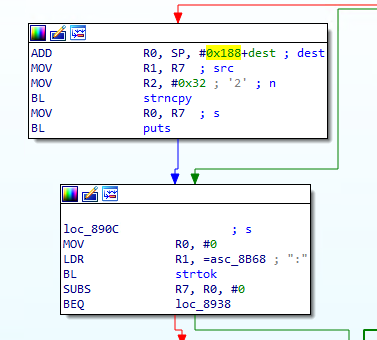
I'm currently working on reverse engineering some binaries extracted from the firmware for an ARM device. After some static analysis identifying functions, argument handling, etc.

I wanted to look for interesting dynamically created strings. The way I went about doing this was to setup a Raspberry Pi (since it also runs on ARM) and could likely execute the extracted binaries. I used to rcFileScan.py tool to identify dependencies and found a couple of custom libraries.
Next I installed the necessary source:
apt-get install libc6-dbg
(Run this one as a regular user, you may have to uncomment the sources line in /etc/apt/sources.list)
apt-get source glibc
I extracted the required custom libraries from the firmware and placed them in the same directory as the binary. Then I added the local directory to the PATH:
export LD_LIBRARY_PATH=$LD_LIBRARY_PATH:.
Next I ran the program in the debugger:
gdb /path/to/bin
Configure gdb:
set pagination off
break _start # Set breakpoint at the _start function.
run # Execute the program
It will break right away on _start.
Next I displayed functions. This might not work if the file has been stripped.
info functions
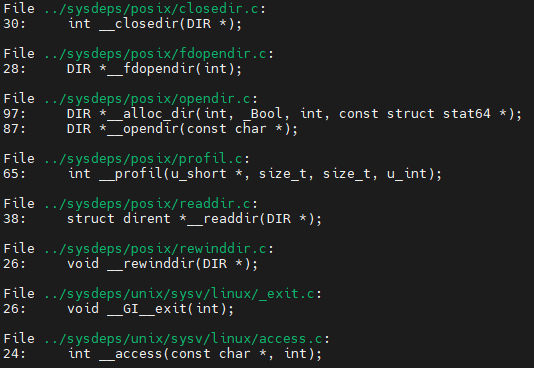
This printed out a large number of lines which looked something like this:

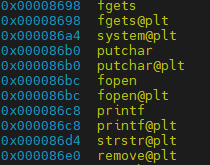
As well as things like this:

Notice the memory addresses are next to the functions. Next I copy and pasted the list of functions into a text file named functions.txt in another window. Then I ran a command to pull out just the memory addresses for the functions and put them in a file named breakpoints.gdb:
cat functions.txt | grep ' [^ ]*()' | awk '{print "break", $2}' > breakpoints.gdb
Then I loaded the breakpoints into gdb:
source /home/user/breakpoints.gdb
Next I configured the directory containing the libc source installed earlier:
directory /home/user
Then I continued the execution of the program a number of times, sometimes stopping to examine memory for specific functions like strcpy. Eventually, I stopped just before exiting and dumped memory to a file.
In order to dump memory first I had to view the memory layout:
info proc mappings
Mapped address spaces:
Start Addr End Addr Size Offset objfile
0x8000 0x9000 0x1000 0x0 /root/binary.elf
0x10000 0x11000 0x1000 0x0 /root/binary.elf
0xf7fbc000 0xf7fde000 0x22000 0x0 /lib/arm-linux-gnueabihf/ld-2.31.so
0xf7fee000 0xf7ff0000 0x2000 0x22000 /lib/arm-linux-gnueabihf/ld-2.31.so
0xfffcf000 0xffff0000 0x21000 0x0 [stack]
Then I dumped regions of memory of interest, for example the stack:
dump binary memory stack_memory_dump.bin 0xfffcf000 0xffff0000
If you dump multiple regions, you can combine these into a single file or analyze them separately. I also have a bash script I wrote for dumping a whole process memory space to a file, but that's for another post.
Now you can run strings on the dump files and see dynamically created strings:
strings --radix=o binary.elf
5524 fopen
5532 fseek
5546 fclose
5726 memcpy
5744 puts
6024 strncpy
6154 sprintf
6214 fread
6222 fwrite
6275 fgets
7601 _edata
7610 __bss_start
7642 __bss_end__
7656 __end__
7666 GLIBC_2.4
(I removed the useful product identifying strings for this post.)
Thankfully this file wasn't obfuscated, nor did it have any anti-analysis aspects, unlike a lot of the malware I analyze. It also used a lot of old, deprecated functions and libraries, however this is very common for all sorts of devices (IoT, OT, automotive and avionics, medical, etc.). They are generally designed to function not to be secure.
Why would you want to do all this? Well sometimes there are strings that are created dynamically at runtime that you can't see statically. You might also want to watch the program as it reads in data from files and acts upon it, or makes network connections. There are a variety of uses for this type of dynamic analysis and other approaches as well.
That's all for now, thanks for reading!
A.

