
Investigating ELK Stack

Our internal lab network's logging and analysis system is built with several components and services, focusing on log aggregation and analysis. The central element is a Linux host that serves as the DNS and DHCP server, and also functions as the network gateway. For network security, this host runs UFW (Uncomplicated Firewall). These services generate logs which are sent to ELK stack which is an open source log aggregation and analysis tool which runs locally within our network. Local handling of logs and other data is important to us from a security perspective.
The ELK stack system's logging mechanism involves three main servers: Logstash, Elasticsearch, and Kibana, hosted on a machine within our local network. Logstash handles the initial log processing from various services, modifying and filtering the data. These processed logs are then sent to the Elasticsearch server, which acts as the storage and indexing engine.
Kibana, interfacing with Elasticsearch, is used for log data analytics and visualization. It provides tools for dashboard creation and real-time data analysis, helping with the interpretation of network activities.
Logstash Filtering
Our Logstash configuration comprises inputs for UDP and Beats, processing diverse log types. UDP input on port 5514 handles syslog logs, while Beats input on port 5044 accommodates various data shippers. Packetbeat logs undergo JSON parsing, with a fallback to Grok parsing for network protocol and IP details. UFW, DHCP, and DNS logs are tagged and parsed using Grok to extract relevant information, with date filters normalizing timestamps. Unnecessary fields are removed for data efficiency and to help with filtering important information. The output section directs processed logs to a local Elasticsearch instance, indexing them daily to allow us to easily review and analyze the data.
In our Logstash setup, we use Grok patterns to parse different types of logs:
For Packetbeat Logs:
- Logstash's
jsonfilter decodes Packetbeat's JSON-formattedmessagefield into structured Logstash events, transforming key-value pairs into accessible event fields. - The pattern
%{WORD:network.protocol} src=%{IP:source.ip} dst=%{IP:destination.ip}pulls out network protocol, source, and destination IPs. This is only used as a fallback if JSON parsing fails as sometimes (rarely) happens due to the variety of messages Packetbeat sends based on different kinds of traffic.
For UFW Logs:
- We use
<%{POSINT:syslog_pri}>%{DATA:syslog_version} %{TIMESTAMP_ISO8601:timestamp} %{HOSTNAME:host} %{DATA:program} - - - \[%{DATA:ufw_action}\] %{GREEDYDATA:ufw_details}to extract syslog info, timestamp, host details, UFW action, and other details.
For DHCP Logs:
- The pattern
%{SYSLOGTIMESTAMP:syslog_timestamp} %{SYSLOGHOST:logsource} dhcpd\[%{POSINT:pid}\]: %{DATA:dhcp_action} %{IP:client_ip}is used for getting syslog timestamp, log source, process ID, DHCP actions, and client IPs.
These Grok patterns help us effectively sort and structure the log data for easier analysis and visualization in our system.
Other services can be easily set up to send their logs to our Logstash server. In that case we would then set up more filters to handle the specific type of logs. In the future logging will be integrated for all our internal networks and services from our internal notes database to other isolated networks we work with. Currently all the data we have in the ELK stack setup is coming from our Linux host mentioned earlier. The DHCP, firewall and Packetbeat data all comes from that machine and is transferred to our ELK stack server.
Packetbeat
Packetbeat is a real-time network packet analyzer within the Elastic Stack, capturing and parsing server traffic into structured formats for insights on network performance and traffic trends. Integrated with Elasticsearch and Kibana, it decodes network packets, correlating them with application-level transactions. As one of the specialized Beats designed for various data types—such as Filebeat for logs and Metricbeat for metrics—Packetbeat streamlines data collection and transportation to Elasticsearch or Logstash for indexing and processing. Our current setup utilizes Packetbeat, but the flexibility of Beats allows for easy expansion to other types of data collection.
It is important to note that while Packetbeat captures and analyzes network traffic metadata, it doesn't create PCAPs of all network activity. Instead, our network employs a full packet capture system to record all traffic through our gateway, a process separate from our current ELK Stack integration but planned for future inclusion. Unlike Packetbeat's metadata-focused approach, this system captures entire packets, data included, offering a deeper analysis level for detailed investigation of communications. Packetbeat is serving as a logging and analysis tool and not as a full packet capture tool.
Here is an example of a log generated by Packetbeat in our Kibana interface. We can identify what device it is sent from as well as the type of network traffic it is, based on the fields present. Each of these fields can be queried separately in Kibana. We can create visualizations and trackers based on any of the fields. This allows us great flexibility in filtering all our logs for information we are specifically after at a given time.

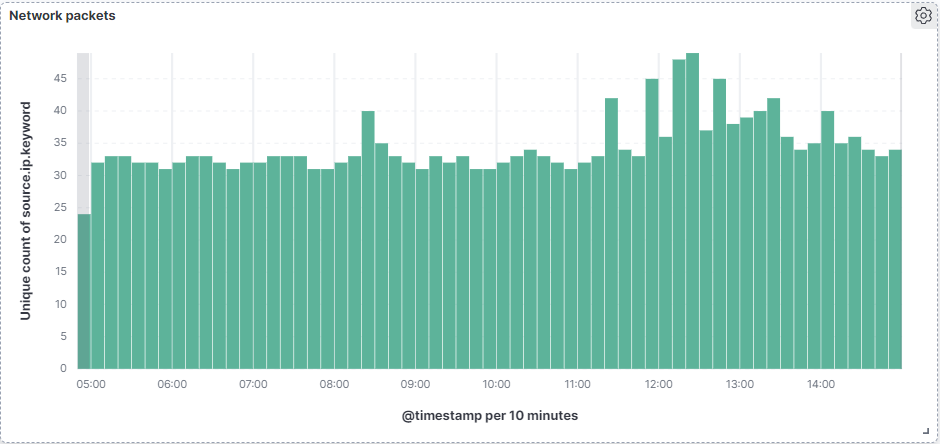
Here is an example of network flow frequency which can show us specific network traffic such as music or video streaming in contrast with other types of network traffic. It helps in monitoring network performance, identifying areas of delay or failure. It also aids in analyzing traffic patterns and bandwidth usage.
DHCP
We are running an ISC-DHCP server on our Linux host. This server manages the internal network and gives out IP addresses as well as manages leases and prevents IP collisions.
Here is an example of a log generated by our DHCP server. This shows what type of DHCP action was done as well the MAC and IP addresses of the machine involved. As before all these fields can be queried individually within our Kibana interface.

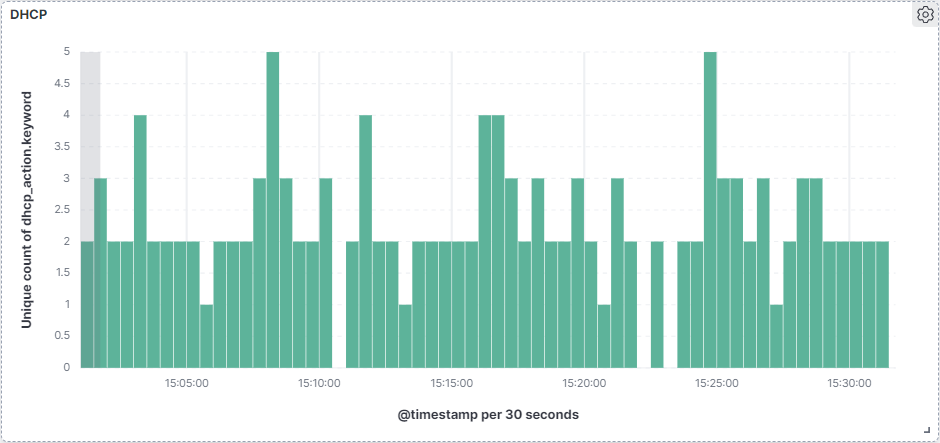
This visualization allows us to see the regular pattern of lease renewals and requests. This allows easier network troubleshooting issues as well as an advantage in analyzing the security of our network.
UFW (Uncomplicated Firewall)
We are running UFW on our Linux host which allows us to audit and control network traffic coming in and out of lab network. This is probably the most useful for security purpose as it allows us to identify discrepancies with network traffic that could indicate a security breach or just abnormal behavior from one of our internal services.

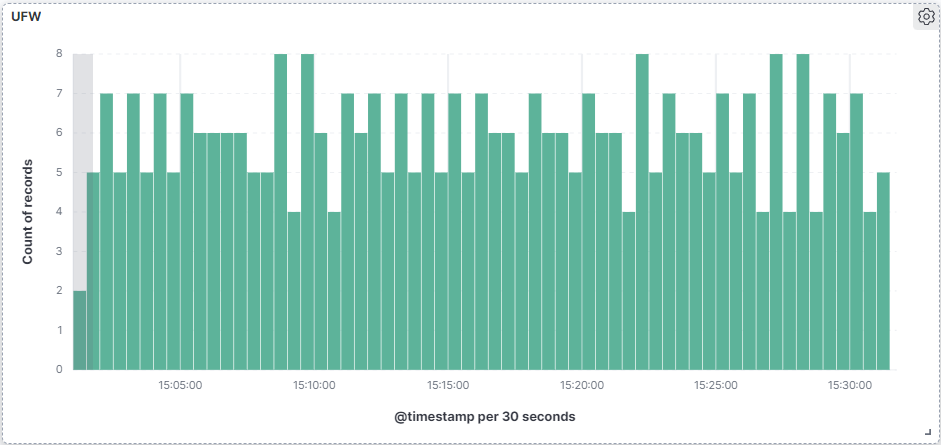
Here the chart showing the overall frequency of UFW logs. This view can be useful in identifying network issues as well as a security analytics tool. For instance a spike in UFW logs could mean a misconfigured service trying to talk out of the network when its not supposed to.
Based on any combination of these fields and tags we can generate specific queries or generate visualizations for specific combinations of tags for any specific situation we might encounter. All these charts and visualizations are created using the KQL which is the Kibana Query Language. This is a valuable tool that you can read more about here which can be used to generate specific queries for our data or create visualizations like we have here.
ELK stack has a variety of other analytical tools including dedicated security analytics. These integrations will be investigated in the future and enable monitoring and security analysis at a deeper level. We plan to set up alerting and notification systems to send alerts if any abnormal network traffic or logs are detected.
My next post will be about Man-In-The-Middle attacks.
Thanks!
Sequoyah